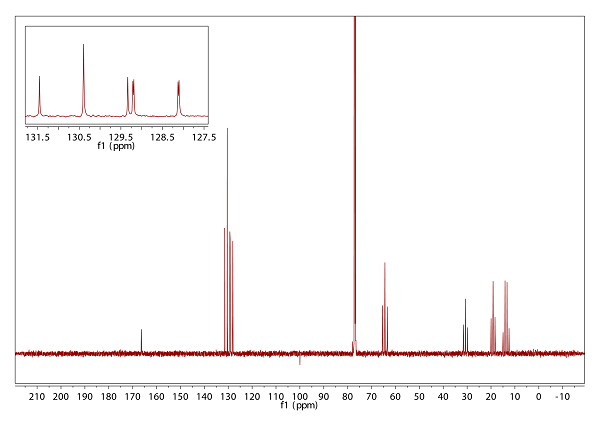
Fig. 13.1: 13C{1H} gated-decoupled NMR spectrum (150 MHz) (click to enlarge). |
Strategy- Fig. 13.1 shows a type of 13C NMR experiment which preserves coupling to 1H. Thus, it is possible to identify the multiplicity of carbon atoms [note, however that this experiment is insensitive as compared to 1J H,C correlations]
- In Fig. 13.2, you will see the 'modern' version of the same experiment [CH and CH3 groups give positive cross peaks (red), CH2 groups give negative cross peaks (blue). Quaternary carbons, as well as OH protons, do not yield any crosspeaks].
- As always, it is helpful to calculate the degree of unsaturation (DBE) from
the molecular formula: C7H12O2.
|
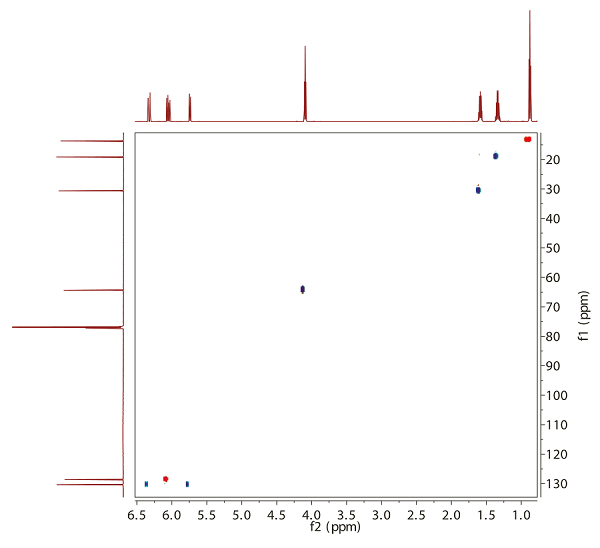
Fig. 13.2: H,C HSQC @ 600/150 MHz (click to enlarge). | 
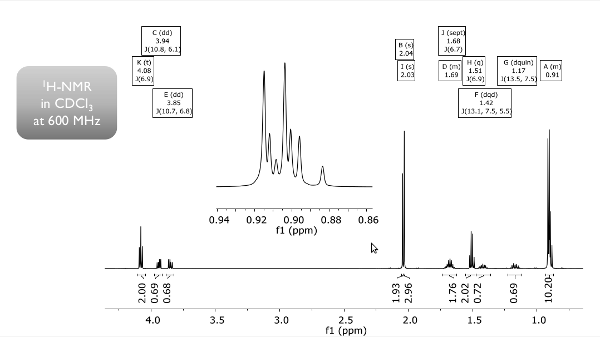
Fig. 13.3: 1H NMR spectrum recorded at 600 MHz (click to enlarge). |
Hints- There are two groups of spin systems in this molecule - they can be verified conveniently with a H,H COSY spectrum (Fig. 13.4).
- Even though there is no HMBC correlation provided here, chemical shifts and H,H correlations help to connect the fragments across the only existing quaternary carbon.
|

Fig. 13.3: H,H COSY (click to enlarge). |
Solution
- The molecule of May could be almost solely elucidated through proton experiments. The only carbon that does not connect to any proton is typical for carboxylic acids and their derivatives.
- The two spin systems are divided into an olefinic AMX and an aliphatic A2M2P2X3 part. The olefinic couplings may be estimated, since 1 ppm corresponds to 600 Hz at the field strength employed for these experiments.
- On cheminfo, there is a nice tool to simulate the 1H NMR spectrum: In the third row, select 'predict 1H' and simply draw the assumed structure with the editor and compare [if you got real spectra, you may even superimpose them as a jcamp file via drag-and-drop].
- If you are still in doubt - the correct structure is found at http://www.nmrshiftdb.org/molecule/60004995.
|
(rs)
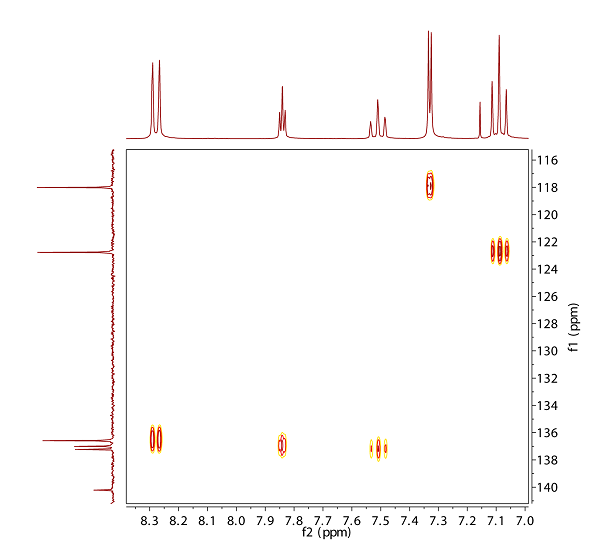
Fig. 12.1: H,C HSQC @ 400/100 MHz (click to enlarge). |
Strategy- The degree of unsaturation (DBE) can be derived from the molecular formula: C10H8.
- Check the number of distinct signals for carbon and hydrogen NMR: This
will give you a clue.
- Carefully analyse the structure of the multiplets visible in the 1D 1H NMR spectrum - if you are struggling, there is a H,H COSY provided, too.
|
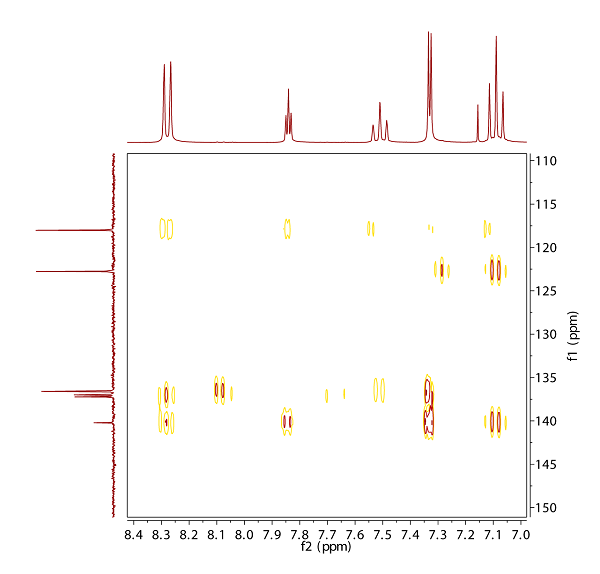
Fig. 12.2: H,C HMBC, 13C chemical shifts: 140.2, 137.2, 137.0, 136.6, 122.8, 118.0, 1H chemical shifts: 8.28, 7.84, 7.51, 7.33, 7.09 (click to enlarge). | 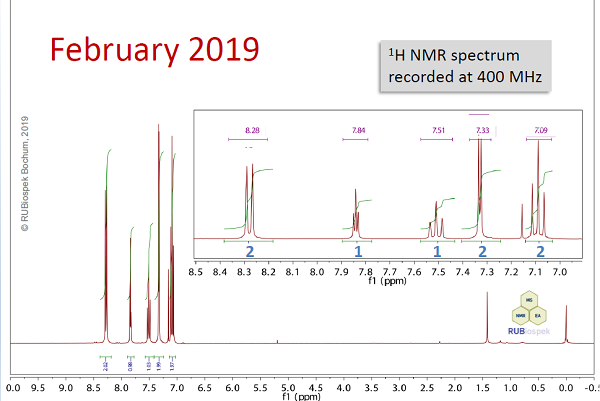
Fig. 12.3: 1H NMR spectrum recorded at 400 MHz (click to enlarge). |
Hints- It is most important to recognise the symmetry of the compound - all chemically equivalent atoms give rise to one common signal. Integration of proton signals is given below the corresponding peaks.
- In the HMBC, most of the cross peaks derive from 3JCH coupling. In the COSY experiment, two spin systems may be identified - caution, there are also long range correlations visible (> 3JHH).
Solution- The molecule of February is quite symmetric - there are four positions that exists twice. Also, it is an aromatic compound for the chemical shifts in the proton spectrum, it contains 7 DBE.
- The two spin systems are divided into an AX2 and an AA'MM'X part. You may simulate such a 5-spin system at icheminfo (middle box in the 'tools' section, choose ABCDE system and set δ 8.28 for A/B, 7.51 for C and 7.09 for D/E. Providing uniform 3J couplings of 7 Hz between A/D, B/E, C/D and C/E is sufficiently accurate).
- Connecting the annulated system is feasible through HMBC correlations. If youare still in doubt - enter the chemical shifts of the 13C signals (compare results with and without carbon multiplicities, i.e. S = no proton attached, D = proton attached) in nmrshiftdb2's search function.
|
|
>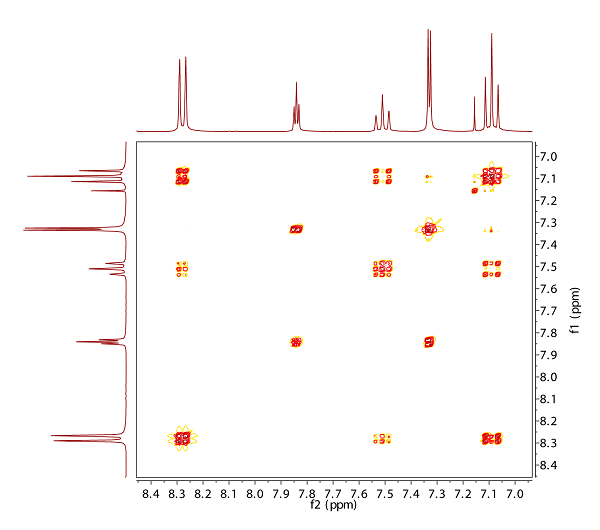
Fig. 12.4: H,H COSY (click to enlarge). |
(rs)
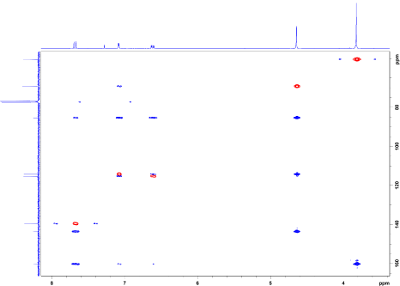
Fig. 10.1: H,C HMBC (blue) and H,C HMQC (red) at 300/75 MHz (click to enlarge). |
Strategy- The spectra for structure elucidation presented this month are a good
example to show, how the QuickCheck tool might assist you. However,
there is a catch in it!
- The experiments shown on the first page derive the C-H connectivities in
the molecule: HMQC with cross peaks for 1JCH are visible in red, while
HMBC peaks for long range correlations (2JCH, 3JCH and some dublets for
1JCH). In aromatic systems, the intensity of 2J cross peaks is weaker than
the one of 3JCH cross peaks.
- The molecular formula of this month's molecule is C8H9IO2. First, derive
the number of DBE (degree of unsaturation).
|
Hints
- The previous two experiments allow to evaluate the compound by
chemical shifts, multiplicity of carbons (APT), signal intensity (integrals 1H)
and by analysis of the H-H coupling patterns. The absolute number of
protons is printed in blue.
- There is one signal the 1H NMR which differs from the other ones in its
broad lineshape. Also, there is no correlation in the HMQC with this proton -
that is why this area is not shown on the first page.
- After identification of the aromatic spin system and collecting information
about individual fragments, try to identify which substituent is bound to
which position by carefully re-investigating the HMBC correlations.
|

Fig. 10.2: APT 13C{1H} NMR spectrum
recorded at 75 MHz (click to enlarge). |

Fig. 10.3: 1H
NMR spectrum
recorded at 300 MHz (click to enlarge). |
Solution- There are only non-equivalent carbons in the target molecule‘s structure -
which means that there is no higher symmetry. For the chemical shifts of
proton signals in the left part, there must be aromatic moiety, which is
supported by the degree of unsaturation (DBE = 4).
- Four spin systems exist in 1H: One O-CH3 unit (3.82), one O-CH2 (4.64) unit, an
"exchanging" OH proton (2.03) and an aromatic AMX spin system. The latter
consists of two protons that are three bonds a part (7.68 and 6.61) and a third
proton (7.08) that shares long-range coupling to the one of them (6.61).
- The substitution pattern of the aromat can be derived through the 3JCH cross
peaks. The location of iodine is easy to spot for the 13C chemical shift. If you
are still in doubt - enter the chemical shifts of the 13C and 1H signals with your
suggested structure in nmrshiftdb2's QuickCheck. The solution can be found here.
|
(nes)
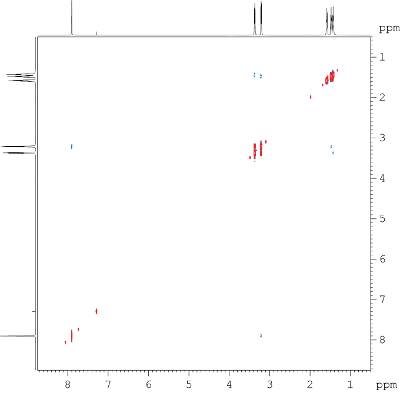
Fig. 9.1: H,H NOESY, 600 MHz, List of 1H chemical shifts: 7.79, 3.27, 3.12, 1.49, 1.38, 1.33 (click to enlarge). |
Strategy- In the H,H NOESY experiment (NOE = nuclear Overhauser effect) shown
in Fig. 9.1, protons which are apart from each other no more than
a distance of 4Å, show cross peaks. Here, through-space, as well as
chemical exchange correlations can be analyzed.
- This experiment is phase-sensitive, i.e. cross peaks that are of the
opposite phase (blue) as the diagonal peaks (red) stem from NOE.
Signals, which are of the same phase as diagonal peaks (red) originate
from chemical exchange.
- The molecular formula of this month's molecule is C6H11NO. What does
this tell you about the number of DBE?
|
Hints
- In Fig. 9.2, H-H correlations through bonds can be inspected in
the COSY experiment. Here, long-range couplings (> 3JHH) are visible in two
cases. The absolute number of protons is printed in blue. Carefully
compare the cross peaks with the ones visible in the NOESY spectrum.
- Take a look at the chemical shifts in the multiplicity-edited APT spectrum
(Fig. 9.3). Here, a C-H carbon stands out due its atypical shift. If you do
a subspectrum search for a doublet (D) at this frequency, the type of
carbons in question can be narrowed down. It might be interesting to
search for the group of sp3 hybridized carbon signals, as well.
- To elucidate the 'skeleton' of the compound, there are H-C correlation
spectra in Fig. 9.4. 1JCH correlations from the HMQC
experiment are labelled in red.
|

Fig. 9.2: H,H COSY, 600 MHz
(click to enlarge). |

Fig. 9.3: APT 13C{1H} NMR spectrum recorded at 150 MHz (click to enlarge). | 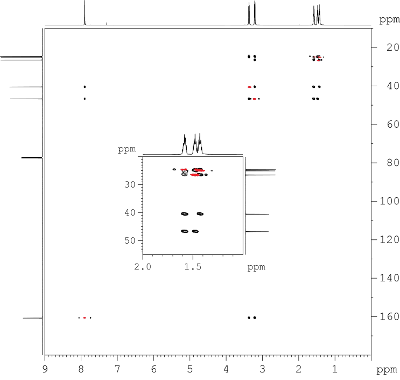
Fig. 9.4: H,C HMBC (black) and HMQC spectra (red) at 600/150 MHz (click to enlarge). |
Solution
- There are six non-equivalent carbons in the target molecule's structure - the
same number as in the molecular formula. Also, there are - with one exception
- no sp2 hybridized carbons, which excludes the possibility of an aromatic/olefinic molecule. Calculation of DBE yields two.
- Connections between the CH2 units are straight forward from the COSY
spectrum: One coupled spin system consisting of 3.12-1.38-1.49-1.33-3.27 can
be identified, additionally, long range correlations from 7.79 to 3.12 and 3.27
are present.
- From the NOESY experiment, exchange can be detected at least between
3.12/3.27. Also, there is only a NOE contact from 7.79 to 3.27, not to 3.12 -
why? If you are still in doubt - enter the chemical shifts of the 13C signals in
nmrshiftdb2 as a "spectrum search" (option "complete").
|
(nes)
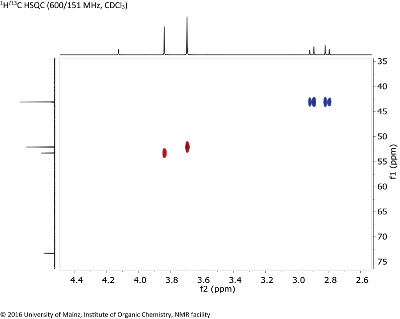
Fig. 8.1: 1H/13C HSQC (600/151 MHz, CDCL3 (click to enlarge). |
Strategy- Given the molecular formula C9H14O7, you can determine the number of double bond equivalents.
- Determine the CHx fragments in the molecule from the edited HSQC spectrum. CH and CH3 groups give positive crosspeaks (red), CH2 groups give negative crosspeaks (blue). Quaternary carbons, as well as OH protons, will not yield any crosspeaks.
- Besides the correlation information, the inspection of the 1D 1H NMR spectrum (projection on top, intensities and chemical shifts given in Fig. 8.2) provides only few couplings. Investigate the 1H chemical shifts at 3.84 & 3.69 through a subspectrum search to get an idea of the type of possible functionalities.
|
Hints
- Do a subspectrum search for the three chemical shifts that appear at the highest frequencies (173.8, 170.2) in the 13C NMR spectrum displayed in Fig. 8.3. Check which are the most common fragments. Include the multiplicity (S) in your search. Repeat and then combine the search for the signals at 53.3, 52.1 (Q).
- Determine the connectivity of the fragments using the HMBC experiment (Fig. 8.4). It shows coupling between 1H and 13C over more than one bond.
- You need to analyze the stereochemistry carefully to see why there is coupling between the protons 2.91 and 2.81.
|

Fig. 8.2: 1H NMR (600 MHz, CDCL3 (click to enlarge). |

Fig. 8.3: 13C NMR (151 MHz, CDCL3 (click to enlarge). | 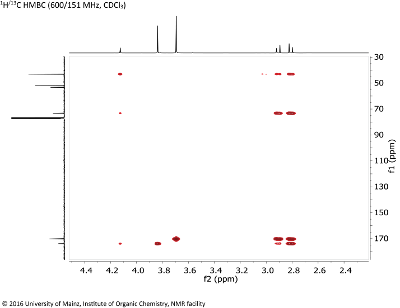
Fig. 8.4: 1H/13C HMBC (600/151 MHz, CDCL3 (click to enlarge). |
Solution
- The target molecule contains, according to DBE (3) and carbon chemical shifts, three carbonyl double bonds, each of an ester moiety. There must be symmetry in the molecule, as is also reflected in the number of 13C signals and the relative intensities of e.g. signals C1 vs. C2, and C4 vs. C5, rsp.
- In the 1H NMR spectrum, symmetry is also detectable: The signals C (δH 3.69) and A/B(δH 2.81/2.91) corresond to double sets of CH3 and CH2 groups. Only one multiplet (an AB system for signals A/B) with a geminal coupling (2JHH = 15.7 Hz) is present, since methylene protons are diastereotopic. Also, there is one OH group, signal E (identified with the aid of HSQC).
- Try to summarize the fragments, before entering your structure in the editor using the prediction menu of nmrshiftdb2. No solution? Enter the chemical shifts of the 13C signals in nmrshiftdb2 as a "spectrum search" (option "complete").
|
(jl)

Fig. 7.1: H,C HMBC spectrum, signal intensities 1H in blue (600 MHz, CDCl3). 1H chemical shifts: 4.26 (q), 2.92 (s), 1.33 (t), 13C chemical shifts: 152.7, 74.7, 74.5, 62.4, 13.8 (click to enlarge). |
Strategy- The only NMR experiment required to solve this month’s problem is the H,C long range correlation (’HMBC’) shown in Fig. 7.1. It shows connectivities between proton and carbon ranging from one (in some cases) up to five bonds .
- Besides the correlation information, the inspection of the 1D 1H NMR spectrum (projection on top, intensities given in blue numbers) presents a simple spin system.
- The molecular formula is C5H6O2, which allows to determine the number of DBE (i.e. degree of saturation) for the structure.
- To facilitate assignment, 13C chemical shifts are labelled in red (CH or CH3), blue (CH2) and black (quaternary C).
|
Hints
- Do a subspectrum search for the three chemical shifts that appear at the highest frequencies (152.7, 74.7, 74.5) and check which are the most common fragments. Include the multiplicity (S, D, ...) in your search.
- The H,C long range correlation experiment needs to be assigned with special care - the expansion shown in Fig. 7.2 allows a clearer insight in the most overcrowded shift range in 13C. Note: The size of the 1J couplings is explicitely printed on the spectrum. It helps to use the empirical rule valid for the degree of hybridization of C-H orbitals and the size of 1JCH.
|
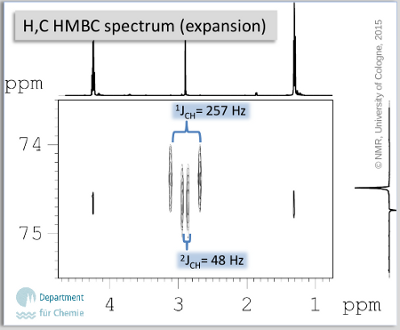
Fig. 7.2: H,C HMBC spectrum (expansion)
(click to enlarge). |
Solution
- The target molecule contains, according to DBE (3) and carbon chemical shifts, a carbonyl double bond as well as an alkyne triple bond (result of subspectrum search).
- 1H NMR allows the observation of an A2X3 spin system (ethyl group) which is bound to an oxygen atom (δH 4.26, 1.33). The remaining signal (δH 2.92) stems from the alkyne; extraordinarily large JCH can be detected from the HMBC (2J ∼ 50 Hz, 1J ∼ 250 Hz are typical for sp hybridized carbons).
- Try to compare the predicted 13C chemical shifts, when entering your structure in the editor using the prediction menu of nmrshiftdb2. This month’s molecule is not yet in our database, however, agreement of experimental and predicted shifts is very good. No solution? Enter the chemical shifts of the 13C signals in nmrshiftdb2 as a "spectrum search" (option "complete") after October 15th.
|
(nes)
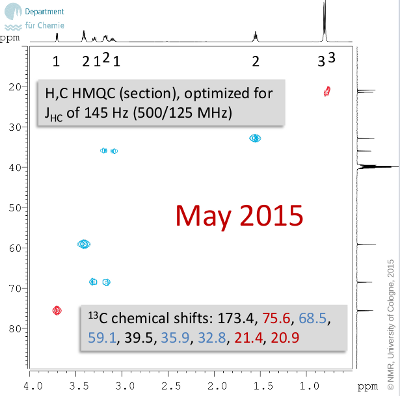
Fig. 6.1: H,H COSY spectrum, signal intensities in blue (500 MHz, DMSO-d6(click to enlarge). |
Strategy- In Fig. 6.1, an H,H correlation experiment is presented which allows to derive three spin systems that are coupled over two or three bonds, respectively. Note, that the spectrum was recorded in DMSO-d6. Thus, correlation can also be observed with so-called ‚exchanging‘ protons.
- It is always useful to determine the number of DBE (i.e. degree of saturation) for the molecule, if the molecular formula is given: C9H19NO4.
- H,C connectivities can be assigned from the correlation experiment shown on the next page. As one can note, there are diastereotopic protons. Protons which are not bound to a carbon show no cross peak. Also, to facilitate assignment, cross peaks in red represent CH or CH3 carbons, while blue peaks signify CH2 groups.
|
Hints
- Quarternary carbon centers are printed in black in the 13C chemical shift list. Take a look at the four chemical shifts that appear at the highest frequencies (173.4 ... 59.1) and check the heteroatoms which are in the molecular formula.
- Another NMR experiment appears to be crucial to solve this problem: Only with H,C long range correlation experiment (HMBC, Fig. 6.2), the fragments identified so far can be connected. Note, that besides correlations for 2J and 3J, also 1J (dublets) are visible in some cases. ‚Exchanging‘ protons do show l.r. correlations, too.
- As an additional hint, there is an expansion of the H,N correlation (1JHN) and a selective NOE experiment available in Fig. 6.3, which deliver information from correlations through bond and through space, rsp.
|
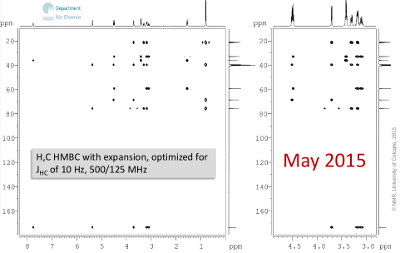
Figure 6.2: H,C HMBC with expansion, optimized for JHC of 10 Hz, 500/125 MHz (click to enlarge). |
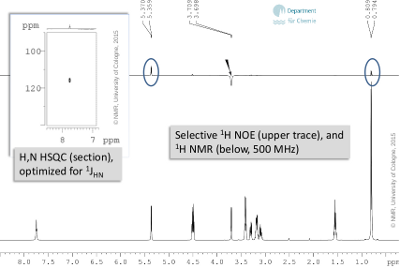
Figure 6.3: Selective 1H NOE (upper trace), and 1H NMR (below, 500 MHz) (click to enlarge). |
Solution
- The target molecule contains, according to DBE (1) and carbon chemical shift, a double bond (ester or amide, result of subspectrum search for δC 173.4). The signal at δH 7.75 correlates to the corresponding amide nitrogen.
- Also, three more exchanging proton signals can attributed to hydroxy groups (δH 5.36, 4.51, 4.49). Since they do show H,H correlations, the spin systems for two primary and one secondary alcohol can be derived; H,C long range correlation and NOE contacts help to integrate amide and diastereotopic methyl groups.
- Try to compare the predicted 13C chemical shifts, when entering your structure in the editor using the prediction menu of nmrshiftdb2. This month’s molecule is not in our database, however, the agreement of experimental and predicted shifts is very good. No solution? Enter the chemical shifts of the 13C signals in nmrshiftdb2 as a "spectrum search" (option "complete") after June 15th 2015.
- The solution has been added to the database.
|
(nes)
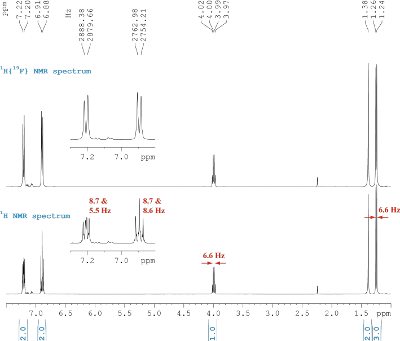
Fig. 5.1: 1H NMR spectra, 400 MHz (click to enlarge). |
Strategy- First, determine the number of DBE for the molecule. Its molecular formula is C8H10FN.
- Various types of 13C NMR spectra are presented in Fig. 5.1: Without 1H or 19F coupling (top trace), with only 19F coupling visible (middle) and with both, 1H and 19F coupling present (bottom). With this information, you can assign the number of attached hydrogen or fluorine atoms.
- Now, assign protons to corresponding carbons from the 1H NMR spectrum in Fig. 5.1. Try to assign the multiplets and derive the observable spin systems. Note, the upper spectrum is 19F decoupled.
|
Hints
- The 1H signal at δH 1.38 will cease, once a drop of deuterated water is added to the sample!
- This information, together with the number of DBE, should be helpful.
- This month’s problem does not contain any through-bond correlation experiments. The only 2D experiment available as additional information is a heteronuclear Overhauser effect (Fig. 5.2). This type of spectrum gives information about nuclei which are (farely) close in space (maximum 4 Å as a rule of thumb).
- Also, you might verify the other part of the aromatic spin system with the 19F NMR spectrum given in Fig. 5.3.
|
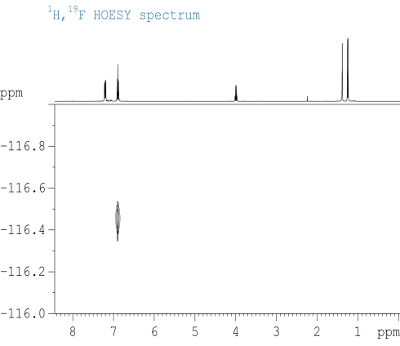
Figure 5.2: H,F HOESY, 400/376 MHz (click to enlarge). |

Figure 5.3: 19F NMR spectra, 376 MHz (click to enlarge). |
Solution
- The target molecule should be, according to DBE and 1H/ 13C chemical shifts in the sp2 region of the spectra, an aromatic compound. From the sum formula and the hint with the perishing signal at δH 1.38 (intensity = 2H), an amine is feasible.
- There is an AA’XX’ system visible in the 1H NMR spectrum, if 19F is decoupled. In combination with the 19F coupling observed in the 13C{1H} spectrum, the substitution pattern can be identified. This is affirmed by the NOE spectrum.
- To derive the aliphatic amine part, the 1H NMR spectrum is sufficient: Here, a AX3 spin system is observed.
- No solution? Enter the chemical shifts of the 13C signals in nmrsshiftdb2 as a "spectrum search" (option "complete") or click here.
|
(nes)
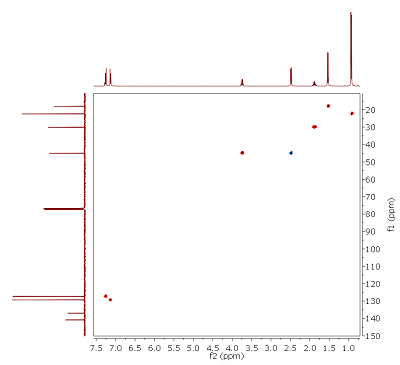
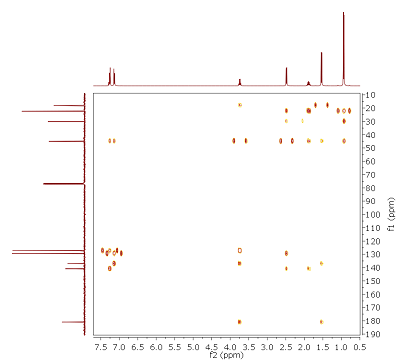
Fig. 4.1: Edited H,C HMQC, optimized for JCH of 145 Hz, 400/100 MHz. List of 13C chemical shifts: 180.9, 140.8, 136.7, 129.4, 127.3, 45.1 (T), 45.0 (D), 30.1, 22.4, 18.1 (click to enlarge). |
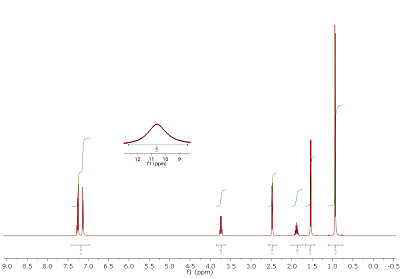
Strategy- This month's molecule has the molecular formula C13H18O2. H,C connectivities can be assigned from the edited HMQC (Fig. 4.1). Note: In this type of experiment, cross peaks in red represent CH or CHi3 carbons, while blue peaks signify CH2 groups. Two signals appear at almost identical shifts (multiplicities in brackets). Integrals of the proton signals are given below the 1D projection.
- Several 13C signals do not possess cross peaks. By comparison with the 1H NMR spectrum (Fig. 4.2), it can be seen that there is also one proton signal without cross peak. In addition, there must be some symmetry in the target structure (number of signals vs. molecular formula). Although from a standard 13C{1H} NMR spectrum no quantitative conclusions can be drawn, relative signal intensities (see 1D projection) should give you a clue.
|
Hints
- In total, three coupled spin system can be derived from 1H and H,H COSY NMR spectra, amongst them a higher order aromatic pattern. Also, from the number of DBE, an aromatic compound should be considered.
- Do a "search by spectrum" in nmrshiftdb2 for one of the fragments (select option "subspectrum"): First, enter the carbons at δC 45.1, 30.1 and 22.4 with their corresponding multiplicity (e.g. "45.1T" for a carbon with a chemical shift of δC 45.1 with two protons attached). Since there are two carbons at δC 22.4, you have to enter this value twice! Observe the type of functional group, that results from your search.
- If additional information is needed, the fragments that you identified by now can be connected with the HMBC (Fig. 4.4).
|
 |
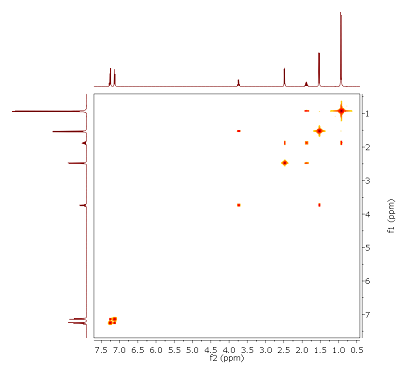 |
| Figure 4.2: 1H NMR spectrum, recorded at 400 MHz (CDCl3). List of 1H chemical shifts and multiplets (brackets): 10.58 (s, broad), 7.26 (,d'), 7.13 (,d'), 3.74 (q), 2.48 (d), 1.88 (d hept), 1.54 (d), 0.93 (d) (click to enlarge). | Figure 4.3: H,H COSY, 400 MHz (click to enlarge). |
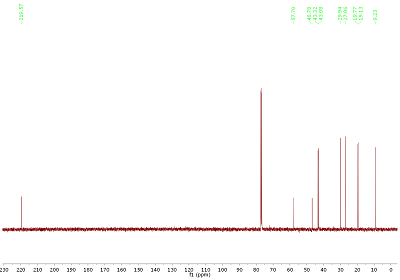
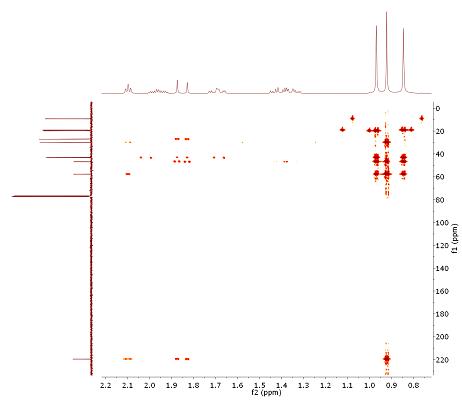
Fig. 3.1: 13C{1H} NMR spectrum, 100 MHz. List of 13C chemical shifts: 219.6, 57.7, 46.8, 43.3, 43.1, 29.9, 27.1, 19.8, 19.1, 9.2 (click to enlarge). |
Strategy- The molecular formula of this month's molecule is C10H16O2: As a first step, it is always important to determine the number of DBE.
- By inspection of the 13C{1H} NMR spectrum in Fig. 3.1, the shift at highest frequency clearly indicates one class of compound. If you are not sure, do a "search by spectrum" in nmrshiftdb2 (select option "subspectrum"): Enter the carbon chemical shift (219.6). From the chemical shifts present, an aromatic or olefinic molecule can be excluded. For easier discussion, 13C signals are labelled from left to right (C1-C10).
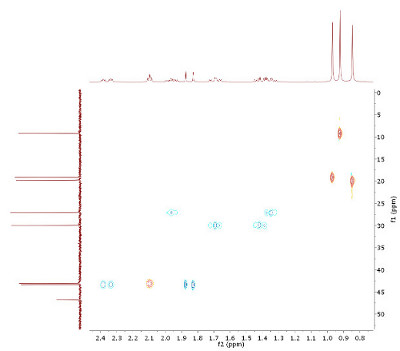
- Assign H,C connectivities from the HMQC (Fig. 3.2). Since this is an edited experiment, cross peaks in red represent CH or CH3 carbons, while blue peaks signify CH2 groups. An HMQC also allows to define diastereotopic protons. Integrals of the proton signals are given below the projection.
|
Hints
- An interesting candidate to look after is the 1H signal at δH 2.1. Do a "search by spectrum" in nmrshiftdb2 (select option "subspectrum"), and enter the carbon shift corresponding to this signal (enter "43.1D" to indicate a shift at δC 43.1 with one proton attached). This brings up some types of molecules which, in combination with the number of DBE, should be helpful.
- This month's problem can best be solved with the assistance of the HMBC (H,C long range correlation) experiment (Fig. 3.3): E.g., all three methyl groups are connected to quarternary carbons (no splitting in 1H). Also, we are dealing with a bicyclic structure (DBE!). After summing up all H-C correlations, dissect the neighbours (e.g. by relating all correlations to the carbon at δC 219.6, etc.). To back up the observations, a COSY spectrum is also provided.
|
 |
 |
| Figure 3.2: Edited H,C HMQC, optimized for
JHC of 145 Hz, 400/100 MHz. 1H chemical shifts: 2.36, 2.10, 1.96,
1.85, 1.69, 1.40, 1.35, 0.95, 0.91, 0.82 (click to enlarge). | Figure 3.3: H,C HMBC (section!), optimized for JHC of 10 Hz, 400/100 MHz (click to enlarge). |
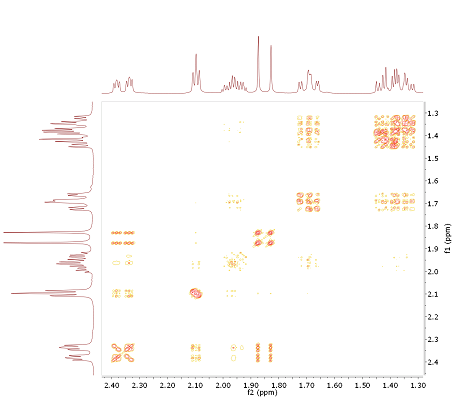
Fig. 3.4: H,H COSY (section!), 400 MHz (click to enlarge). |
Solution
- The target molecule contains, according to DBE (3) and carbon chemical shifts, a double bond (ketone, result of subspectrum search for δC 219.6) and two rings. Also, three methyl groups, attached to the two residual quarternary carbons, are present (δH 0.95/0.82 to δC 46.8 and δH 0.91 to δC57.7).
- Subspectrum search for the 13C signal at δC 43.1 derives the option of a bridge head carbon. Thus, visible H,C l.r. correlations for this atom are mainly for 3JCH connectivities. In combination with the methyl fragments mentioned above, this allows to distinguish fragments C10-C2, C4 and C5 as the next neighbours of C1. For the assignment of C6/C7, the COSY spectrum elucidates a chain of coupled spins H6-H7-H5-H4.
- No solution? Enter the chemical shifts of the 13C signals in nmrsshiftdb2 as a "spectrum search" (option "complete") or click here.
|
(rs)
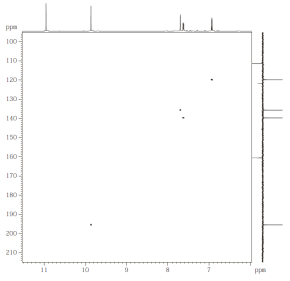
Fig. 2.1: H,C HMQC, optimized for JCH of 145 Hz, 500/125 MHz (click to enlarge). |
Strategy- The molecular formula of this month's molecule is C7H5BrO2: As a first
step, determine the number of DBE.
- Assign H,C connectivities from the HMQC (Fig. 2.1). There is one 1H
signal without cross peak. Identify the different types of protons in the target
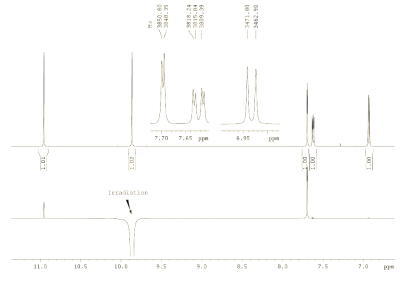
compound by comparison with the 1H NMR spectrum in Fig. 2.2 (upper trace). Note: The 1D projection of the 13C NMR spectrum is
multiplicity-edited!
- Do a "search by spectrum" in nmrshiftdb2 (select option "subspectrum"),
and enter the carbon shift corresponding to the 1H signal at 9.9 ppm (enter
"195.5 D" for a shift at 195.5 ppm having one proton attached to it). This
provides you with a valuable hint.
- Finally, evaluate the through-space information yielded from the 1D NOE
spectrum (Fig. 2.2, lower trace).
|
Hints
- There is only one coupled spin system visible in the 1H
NMR spectrum. Also, from the number of DBE, an aromatic
compound should be considered.
- The information yielded from nmrshiftdb2 search
derives a characteristic functional group which is present in
the molecule. Its neighbour protons are visible in the 1D
NOE experiment.
- Summing up these informations, an aromatic molecule
is identified. The substitution pattern can be deduced from
NOE, 1H coupling pattern and HMBC (Fig. 2.2, Fig. 2.3)
|
 |
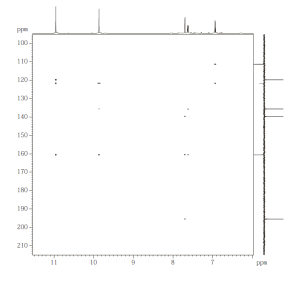 |
| Figure 2.2: 1H NMR spectrum, recorded at 500 MHz (CDCl3 ) (top), 1D 1H NOE spectrum (bottom) (click to enlarge). | Figure 2.3: H,C HMBC, optimized for JHC of 10 Hz, 500/125 MHz (click to enlarge). |
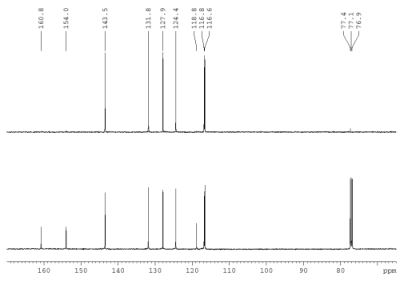
Fig. 1.1: DEPT135 (top) and 13C{1H}
NMR spectra, 125 MHz (click to enlarge). |
Strategy- This month's molecule has the formula C9H6O2.
Check first the number of DBE.
- After assigning H,C connectivities (Fig. 1.3,1.4), try to identify existing spin systems from the 1H projection of the HSQC. Relative intensities are indicated below the 1H trace.
- Do a "search by spectrum" in nmrshiftdb2 (select option "subspectrum"), and enter the two leftmost carbon shifts with their corresponding multiplicity (e.g. enter "123.4 T" for a shift at 123.4 ppm with a triplet splitting ).
|
Hints
- There are two spin systems visible in the 1H NMR spectrum.
- From your search for the two signals at δC 160.8
and 154.0, you should obtain an idea, which type of compound we are looking for.
- Additional information can be gained from the selective 1D NOE experiment provided in image 4.
| 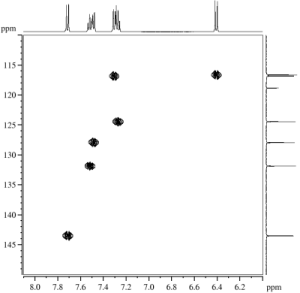 
Fig. 1.2 (left): H,C HSQC, optimized for JHC of 145 Hz, 500/125 MHz, Fig. 1.3 (right): H,C HMBC, optimized for JHC of 10 Hz, 500/125 MHz (click to enlarge). |
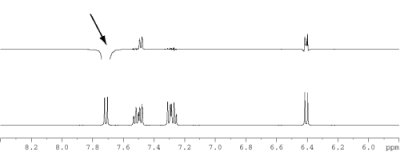
Figure 1.4: 1D 1H NOE spectrum, irradiation frequency indicated (arrow), 500 MHz (click to enlarge). |


